
How It Works
Get an Edge on the Market
By Understanding MMA Market Timing Tools.
At Merriman Market Analyst, we combine cycles, geocosmic events, and traditional indicators—such as price dynamics, technical patterns, and stochastics—to uncover market trends and correlations.
By leveraging these diverse analytical tools, we generate forecasts and offer a comprehensive suite of products, equipping our clients to navigate the complexities of financial markets and make confident, informed investment decisions.
How It Works
Analyzing Market Movements
At the core of our approach lies a thorough analysis of various factors influencing market movements. We meticulously gather and scrutinize a wealth of data, encompassing cycles, geocosmic events, price dynamics, technical patterns, stochastics, and prevailing trends. This comprehensive examination allows us to identify patterns and correlations, enabling us to decipher the underlying trends within the market.
Predicting Trends
Armed with a deep understanding of market dynamics, we employ sophisticated algorithms and analytical models to predict future trends. By synthesizing the insights derived from our diverse range of analytical tools, we generate forecasts that provide insightful guidance on the direction of market movements. These predictions serve as invaluable indicators, offering clarity amidst the complexities of financial markets.
Utilizing Trends
Once trends have been identified and validated, we translate this knowledge into actionable strategies. Our team of experts assesses the implications of these trends across various asset classes and investment instruments. Whether it’s equities, commodities, currencies, or other financial instruments, we tailor our strategies to capitalize on the prevailing market dynamics.
Market Beating Products
With our portfolio of products, our customers are able to make well-informed decisions. Whether it involves optimizing entry and exit points, rebalancing portfolio allocations, or safeguarding against potential risks, our recommendations are crafted to improve overall outcomes. By aligning decisions with identified trends, investors can confidently navigate the markets, seizing growth opportunities while mitigating potential downsides.
Shop ProductsScorecard 2024
A Track Record of Performance
Economic and Market Forecasts for 2023
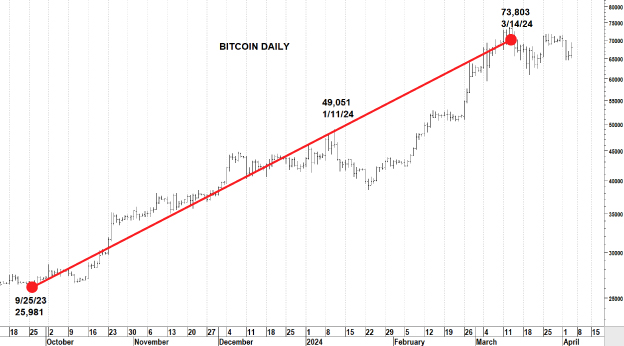
Bitcoin Recommendation (September 25, 2023)
MMA Weekly Report, Gianni Di Poce’s recommendation was, “…Try the long side again this week on a drop to 26,000 +/- 200 with a stop loss on a weekly close below 24,925.”
The Results
Bitcoin exploded to new all-time highs in the coming weeks and months.
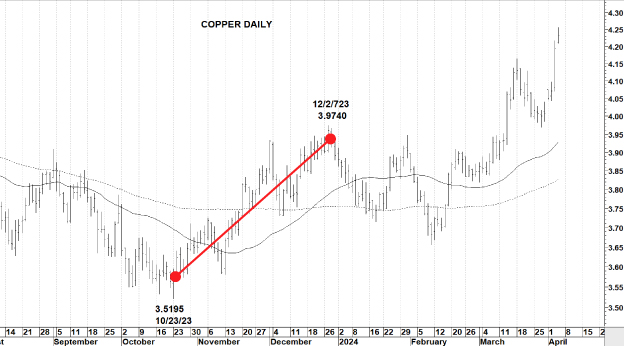
Copper Recommendation (October 17, 2023)
MMA Monthly Cycles Report, MMA’s recommendation was, “In this case, we should not wait too long before the primary bottom is hit for good: the time bands for primary, half-primary, and trading cycles overlap between October 16 and 25. If the primary bottom is not yet in, we thus expect it to form on October 28, +/- 3 trading days. If so, it will most certainly be below 3.5450, implying a bearish ending to this primary cycle.”
November 7 (PT price target): “(…) our price target areas for this primary cycle are 3.94-4.06, and 4.20-4.39 on a breakout.”
The Results
Stocks exploded to 3.9740 on December 27, and new all-time highs in April 2024.
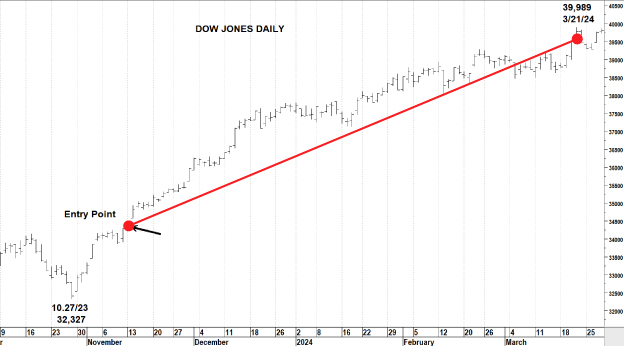
DJIA Recommendation (November 13, 2023)
MMA Weekly Cycles Report, Gianni Di Poce’s recommendation was, “.. try the long side on a drop to 34,000 +/- 60 with a stop loss on a daily close below 33,274, or go long on a daily close above 34,440 with a stop loss on a weekly close below 33,390 – whichever happens first.”
The Results
Stocks exploded to new all-time highs in the coming weeks and months.
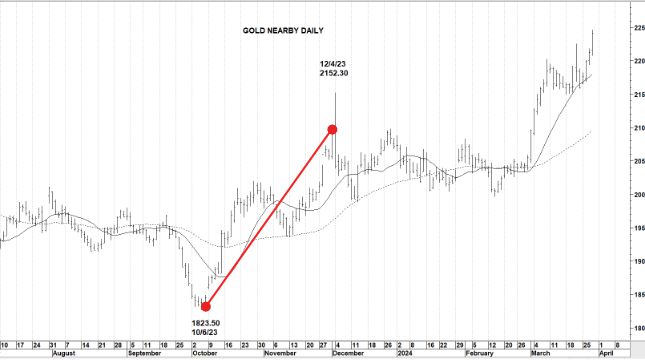
Gold Recommendation (October 2, 2023)
MMA Weekly Report (full and Gold), Ray Merriman’s recommendation was, “Let’s go long at 1825 +/- 10 with a stop-loss on a close below 1790.”
The Results
Gold bottomed at 1823.50 that week. By December 4, less than two months later, it traded as high as 2152.
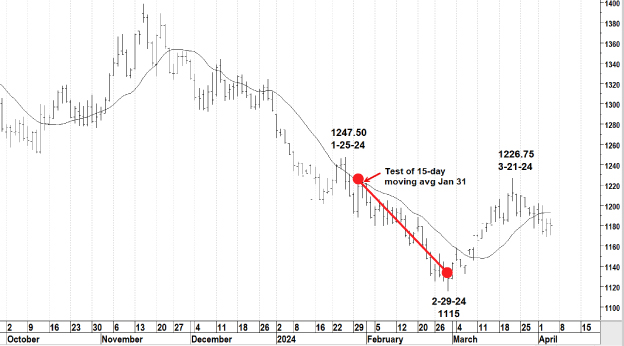
Soybeans Recommendation (January 29, 2024)
MMA Weekly Report, Wyatt Fellows recommended, “Try the short side on any rally back to the 15-day moving average early this week. If filled exit 1/3 at 1185.00 +/- 5.00. Use a stop loss on a weekly close above 1260.00 for now.”
The Results
Soybeans rallied to 1223.00 on Wednesday, January 31 with the 15-day moving average coming in at 1222.00 on that day. Soybeans proceeded to fall for the next 4 weeks into a primary cycle low, reaching a price of 1128.50 on February 29 and 1115.00 in the March contract.
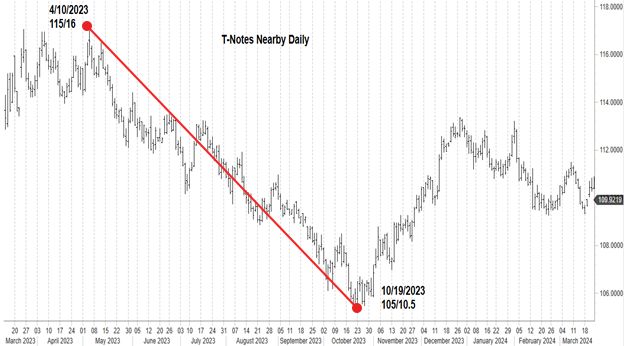
T-Notes Recommendation (April 10, 2023)
MMA Monthly Cycles Report, Gianni Di Poce’s recommendation was, “…sell short at current price levels with a stop loss and revert back long on a close above 117/05… On this initial short position, look to cover 1/3 on a drop to 111/11 +/- 6 if offered.”
The Results
T-Notes began a multi-month decline down to a low of 105/10.5 in October 2023.

Expert Analysis
Our comprehensive approach to market prediction provides unparalleled insights and market-beating results.
Drawing from diverse backgrounds in commodities and currencies, our global team of analysts offers a comprehensive understanding of global markets. This breadth of experience enables them to identify unique opportunities and navigate fluctuations with precision, delivering strategic insights that drive success for our clients worldwide.
Meet the TeamOur Products
Tailored Market Insights
By combining the expertise of our global team with a suite of informative tools, we aim to provide investors with a unique edge in navigating the ever-changing market landscape.
Shop Products