Merriman Market Analyst

The leader in Market Timing Products and Services

Shop Products & Services

As Seen On

Merriman Market Analyst

Innovative market timing solutions, leveraging a combination of advanced analytical methodologies.

See How it Works

Empowering Investors with Market Insights - Merriman Market Analyst combines decades of expertise with innovative tools to give investors a unique edge in navigating financial markets. Through market timing, geocosmic cycles, and technical analysis, we provide resources and education to help traders make informed decisions and take control of their financial future.

Scorecard 2024

A Track Record of Performance

Economic and Market Forecasts for 2024
Bitcoin Forecast Graph

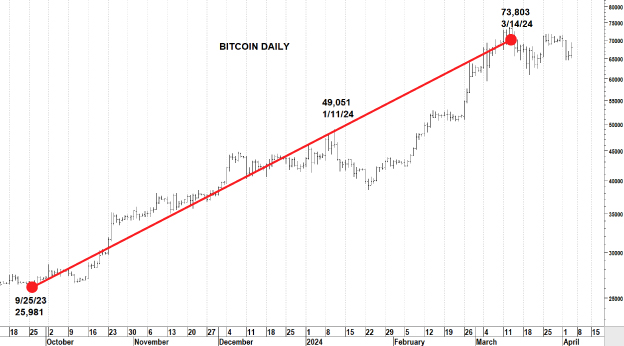
Bitcoin Recommendation (September 25, 2023)

MMA Weekly Report, Gianni Di Poce’s recommendation was, “…Try the long side again this week on a drop to 26,000 +/- 200 with a stop loss on a weekly close below 24,925.”

The Results

Bitcoin exploded to new all-time highs in the coming weeks and months.

Copper Forecast Graph

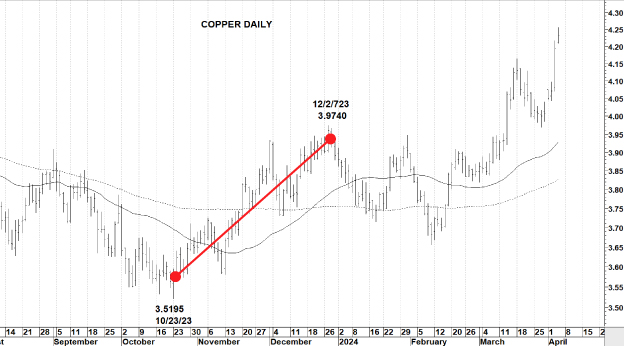
Copper Recommendation (October 17, 2023)

MMA Monthly Cycles Report, MMA’s recommendation was, “In this case, we should not wait too long before the primary bottom is hit for good: the time bands for primary, half-primary, and trading cycles overlap between October 16 and 25. If the primary bottom is not yet in, we thus expect it to form on October 28, +/- 3 trading days. If so, it will most certainly be below 3.5450, implying a bearish ending to this primary cycle.”

November 7 (PT price target): “(…) our price target areas for this primary cycle are 3.94-4.06, and 4.20-4.39 on a breakout.”

The Results

Stocks exploded to 3.9740 on December 27, and new all-time highs in April 2024.

Dow Jones Industrial Average Forecast Graph

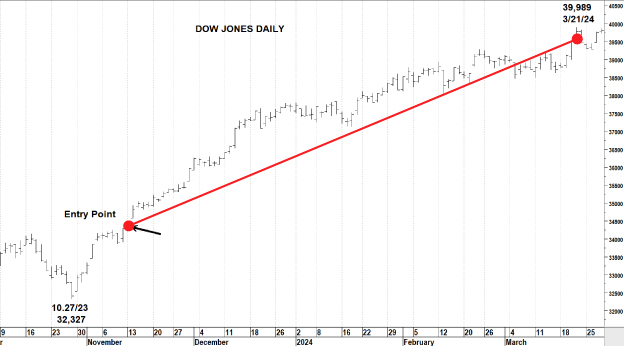
DJIA Recommendation (November 13, 2023)

MMA Weekly Cycles Report, Gianni Di Poce’s recommendation was, “.. try the long side on a drop to 34,000 +/- 60 with a stop loss on a daily close below 33,274, or go long on a daily close above 34,440 with a stop loss on a weekly close below 33,390 – whichever happens first.”

The Results

Stocks exploded to new all-time highs in the coming weeks and months.

Gold Forecast Graph

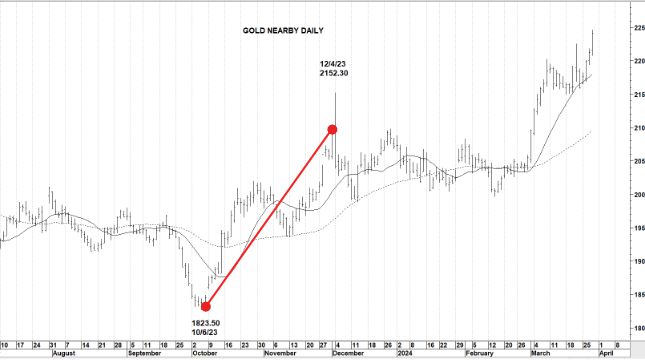
Gold Recommendation (October 2, 2023)

MMA Weekly Report (full and Gold), Ray Merriman’s recommendation was, “Let’s go long at 1825 +/- 10 with a stop-loss on a close below 1790.”

The Results

Gold bottomed at 1823.50 that week. By December 4, less than two months later, it traded as high as 2152.

Soybeans Forecast Graph

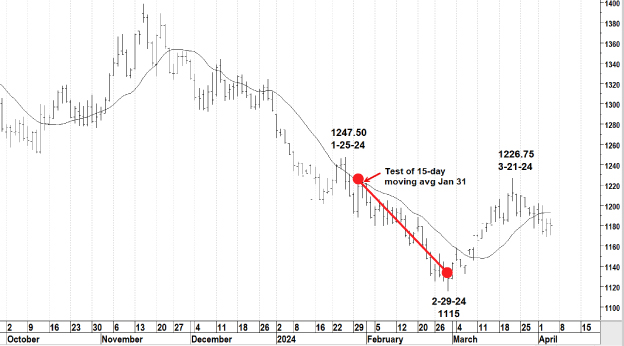
Soybeans Recommendation (January 29, 2024)

MMA Weekly Report, Wyatt Fellows recommended, “Try the short side on any rally back to the 15-day moving average early this week. If filled exit 1/3 at 1185.00 +/- 5.00. Use a stop loss on a weekly close above 1260.00 for now.”

The Results

Soybeans rallied to 1223.00 on Wednesday, January 31 with the 15-day moving average coming in at 1222.00 on that day. Soybeans proceeded to fall for the next 4 weeks into a primary cycle low, reaching a price of 1128.50 on February 29 and 1115.00 in the March contract.

T-Notes Graph

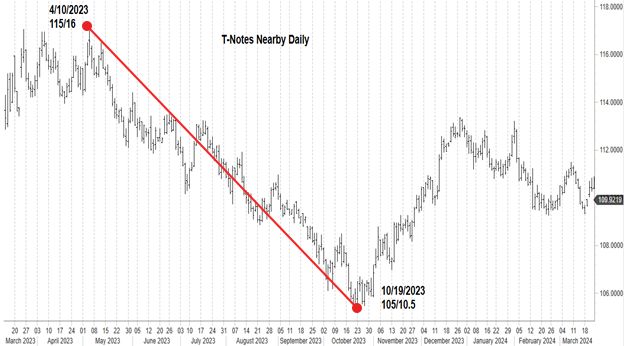
T-Notes Recommendation (April 10, 2023)

MMA Monthly Cycles Report, Gianni Di Poce’s recommendation was, “…sell short at current price levels with a stop loss and revert back long on a close above 117/05… On this initial short position, look to cover 1/3 on a drop to 111/11 +/- 6 if offered.”

The Results

T-Notes began a multi-month decline down to a low of 105/10.5 in October 2023.

Our Products

Tailored Market Insights

Utilizing sophisticated research methodologies, we offer avant-garde tools that grant unparalleled foresight. Our arsenal seamlessly integrates Cycles, Geocosmic Signatures, and Trend Analysis patterns, empowering discerning investors with invaluable market interpretation capabilities.

Join us in navigating the intricacies of the financial landscape, where precision and efficacy converge. Subscribe to Merriman Market Analyst and embark on a path to informed and strategic investment decisions.


Shop Products

Our Experts

Our comprehensive approach to market prediction provides unparalleled insights and market-beating results.

Drawing from diverse backgrounds in commodities and currencies, our global team of analysts offers a comprehensive understanding of global markets. This breadth of experience enables them to identify unique opportunities and navigate fluctuations with precision, delivering strategic insights that drive success for our clients worldwide.


Meet the Team

Testimonials

In their words

I'd like to thank everyone at MMA for excellent work this year. Due to your services, I have uncovered a passionate interest in financial market timing and astrology, and I have been able to turn my investing journey from one of stress and frustration to one of excitement and enjoyment. Reading your reports has become a highlight of my day.

- Will H

Wow! I was so excited speaking with Ray. Your work so far this year is unbelievable, I had to back test your monthly newsletters started trading it Dec 28. All your 1–3-star CRD’s are hitting as I trade TNA and TZA. So far amazing results.

- Gary L

I want to give you rave reviews on your work... ...I've been working through your 5 book series and I have to say they've really filled in gaps and have put my analysis and trading on steroids. This is some incredible work.

- Brad N

The Daily Report is the best investment ever made, it simply confirms some of my own calculations, but most important it is a real confidence booster. It really clears up the short term to survive the long term. Absolutely priceless.

- Charlie H

Thanks to Raymond Merriman, I have closed 36 trades this year with a win rate of 86%. Ray’s predictive ability is remarkable. No one predicts more accurately. I highly recommend his daily newsletter which covers many markets.

- Robert W

You projection of a major market turn in the Oct 1 Market Outlook - a week in advance - was truly incredible. BIG Congratulations.

- David L

That was a spectacular webinar you put on (February 18, 2024)! I watched it from beginning to end. Thank you. Thank you. Thank you for speaking on the term, “Aries Vortex“. The webinar covered every possible question I could come up with, and you gave succinct and direct advice.

- Daniel G

Today's webcast was extraordinary! The graphics are superior including the background in your presentation; adding Gianni, Matthieu, and Wyatt takes it to the next level.

- Richard B

Your life’s work is insightful, enlightening, and inspiring. My perspective on the markets, and perhaps life, have changed dramatically since being gifted the privilege of joining MMTA2. I am extremely grateful for having been given the opportunity to learn directly from you.

- Kyle M

Doing these research projects and really dissecting the cotton market during this course has allowed me to trade cotton very successfully over the last year. It is extremely rewarding to do the work and then to watch it unfold according to plan.

- Wyatt F

Frequently Asked Questions

What are geocosmic patterns and cycles, and how do they work?

Gecosmic patterns are spatial, mathematical relations between the planets to one another and to earth.  We call them “aspects” or stations.
For example, when two planets are close together as seen from earth, it is known as a “conjunction” aspect, or the start of a “synodic cycle.” When they are 90 degrees apart, or one-quarter of the 360-degree cycle between the two planets as seen from earth, it is known as a “square aspect.” We also divide the orbital circle by 2 (opposition), 3 (trine), 6 (sextile) or 8 (semi-square). These are the most common divisions of spatial relationships or patterns between planets.
The idea is that when certain planets are in one of these aspects to one another, trends in financial markets reverse. The longer the planetary cycle involved, the longer the market trend underway will culminate or end – and a new one will begin. The idea is supported by our quantitative research studies published in our 5-volume series of books titled: The Ultimate Books on Stock Market Timing, which shows this correlation data of markets going back to the 17th century.


Do geocosmic signatures and cycles have any influence on the stock market?

Absolutely. The Earth’s environment is constantly bombarded by subtle energies from celestial bodies like planets, the sun, and even the moon. These energies, along with astronomical cycles, can influence human behavior and mass psychology, which ultimately impacts markets.


How can geocosmic signatures and cycles be used to predict stock market trends?

First of all, understand that our studies and correlations are based on historical rates of frequencies. Hardly any geocosmic factor is 100%. But many have frequencies of correlation occurring in the 80% or higher bracket. We have found that future correlations under these factors continue to unfold with the same rate of frequency. So, we consider market reversals will have a higher probability when these same astronomical patterns are in effect.
Of most importance is when these geocosmic patterns unfold when a market cycle is also due, for markets have rhythmic cycles of their own. For instance, most markets have an 18-week primary cycle, within an orb of three weeks. Our studies show that this time band can be narrowed down to three trading days or less if a strong geocosmic signature is in effect during this time band. Some geocosmic factors are stronger than others, which we label Levels 1, 2, or 3, depending on their historical correlation to reversals.
This is how we forecast reversals in financial markets. We prefer the word “forecast” to “prediction”, because the word forecast refers to probabilities. We identify those time bands that have the highest probability to the completion of a market cycle that is due at that time. This is the basis for our higher-than-average accuracy in forecasting market turns. This provides the edge that all traders seek, and is the reason our clients have supported us for so many years. MMA’s market timing methodology works very well.


Are geocosmic signatures sole predictors of market trends?

No. Markets also have rhythmic cycles that have patterns. For example, an 18-week cycle has sub-cycles of two 9-week intervals, and/or three sub-cycles of 6-week intervals, each with a narrow time band known as an orb of allowance. We start our analysis with knowing the market’s rhythmic cycle – when is each cycle or its sub-cycle due? Then we look for the geocosmic signature that is unfolding then – if there is one. These are the criteria we use for identifying a time band of importance to trade. You may call these triggers or leading indicators in our methodology..
Then we go further and look for supporting indicators of a reversal set up. These are more like coincident indicators, such as a chart pattern or for a price target range to be met. We may even then look for a technical momentum indicator of overbought/oversold to support that a change in trend is ready. When all – or several – of these conditions are in place, the buy or sell signal in our strategy to subscribers is enacted.


Learn How It Works