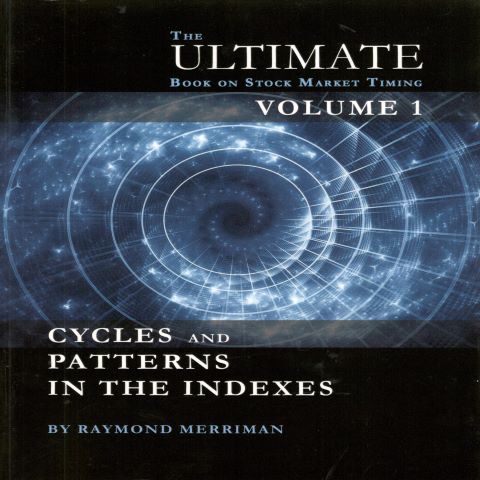
The Ultimate Book on Stock Market Timing, Volume 1: Cycles and Patterns in the Indexes
$125.00
These are the kind of questions often asked of market analysts, and market timers. These are also the kind of questions that are addressed in the classic book on cycle studies, written by Raymond Merriman. Originally written in 1997, with a second edition in 2005, this classic is now updated and re-written for the first time in 12 years.
This is a very special book in the field of market timing. No other book has researched and identified as many reliable and accurate cycles in stock indices as this. That is why it is a classic – a valuable reference book that will be used many times over for many year into the future.
Full Description
These are the kind of questions often asked of market analysts, and market timers. These are also the kind of questions that are addressed in the classic book on cycle studies, written by Raymond Merriman. Originally written in 1997, with a second edition in 2005, this classic is now updated and re-written for the first time in 12 years.
This is a very special book in the field of market timing. No other book has researched and identified as many reliable and accurate cycles in stock indices as this. That is why it is a classic – a valuable reference book that will be used many times over for many year into the future.
Several stock market cycles have unfolded since the second edition of this book was released in 2005, including a new 72-year cycle and all of its phases. This new edition updates all the long-term (4-year or greater), intermediate-term (50-week to 4-year), and shorter-term cycles (primary and its phases) in the Dow Jones Industrial Average, S&P futures, and Japanese Nikkei. From these charts (some going back to the 1690’s), all cycles are labeled and then analyzed structurally to identify their 80+% periodicity ranges. The daily and weekly charts are then analyzed for bottoming and peaking correlations to six key technical indicators and chart patterns. The various phases of cycles are examined for bullish and bearish trends and triggers, providing the means to forecast – and then confirm – optimal time bands for future cycle troughs and crests. The studies performed in this book are original, insightful, and valuable to both traders and investors looking for that extra “edge” in deciding when to buy or sell.